NDP - Neutron Depth Profiling
PINeutron Depth Profiling (NDP) is an isotope specific, non-destructive nuclear analytical technique. It is used for the measurement of concentration profiles of elements in the near-surface region of solids. The technique, first reported by J. F. Ziegler et al. [J. Appl. Phys., 43 (1972) 3809] in 1972, exploits the existence of prompt exoenergetic non-resonant nuclear reactions of certain light isotopes (see Tab. 1) with low energy (< 10-2 eV) neutrons.
To obtain a depth distribution of elements, samples (kept in a vacuum) should be illuminated uniformly with a thermal (or cold) neutron beam. Reactions (n, p) and (n, alpha) of low energy neutrons with reactive atoms produce isotropically emitted monoenergetic charged particles. These, passing through the samples, lose their energy via numerous interactions with electrons. Upon leaving the sample surface the particles retain residual energies, which are directly related to the place of their origin (i.e., to the depth where the reaction took place). Because the low energy neutrons carry only very little momentum, the reaction centers of mass coincide with the sites of the parent atoms.
The energy spectra reflect the distribution of the elements in depth (i.e., lower energy corresponds to greater depth and higher counting rate to higher concentration). To obtain the concentration profile of elements, deconvolution of the energy spectra must be performed. Basically, the concentration C(x) of the elements in the depth x of the samples is related to the energy spectrum S(E) of the reaction products (charged particles) leaving the sample surface with energy E by the relation
C(x) = k S(E) |dE/dx| (1)
The constant k involves the probability of producing and detecting the charged particles and |dE/dx| represents the stopping power of the charged particles in the sample. In the energy range under consideration the stopping power is a relative constant and the energy spectrum of the charged particles corresponds proportionally to the concentration distribution of the parent atoms, i.e., C ~ S and x ~ E. To process the equation (1), the stopping power coefficients (characteristic for the materials) have to be estimated. The stopping powers were compiled by Ziegler [The Stopping and Ranges of Ions in Matter, vol. 1, Pergamon, Oxford, 1985].
In Tab. 1, a summary of the basic reaction characteristics and the detection limits of NDP in NPI Rez are presented. Upon capturing slow energy neutrons the elements (listed in Tab. 1) undergo exoenergetic charged particle reactions, which produce either protons or alpha particles (depending on the isotope), and recoiling nuclei. Each emitted particle has a well-known kinetic energy (defined by Q-value of the reaction), by which the parent elements can be identified. The detection limits given in Tab. 1 are based on the charged particle counting rate 0.01 counts per second, detector-sample solid angle 0.03 Sr, and intensity of the thermal neutron beam th = 107 nth cm-2s-1 (i.e., to the moderate 8 MW power of the LVR-15 reactor).
|
Nuclide
|
Natural abundance or activity* |
Nuclear
|
Cross |
Energy of |
Detection limits |
|
|
3He |
0.00013 |
3He(n, p)3H |
5326 |
573 |
191 |
3.1 x 10¹³ |
|
6Li |
7.42 |
6Li(n, a)3H |
940 |
2051 |
2734 |
1.8 x 10¹⁴ |
|
7Be* |
2.5 x 10¹⁴ |
7Be(n, p)7Li |
48000 |
1438 |
207 |
3.5 x 10¹² |
|
10B |
19.6 |
10B(n, ag)7Li |
3606 |
1471 |
839 |
4.3 x 10¹³ |
|
10B |
19.6 |
10B(n, a)7Li |
230 |
1775 |
1014 |
6.7 x 10¹⁴ |
|
14N |
99.64 |
14N(n, p)14C |
1.81 |
584 |
42 |
9.1 x 10¹⁶ |
|
17O |
0.037 |
17O(n, ag)14C |
0.24 |
1415 |
404 |
7.1 x 10¹⁷ |
|
22Na* |
4.4 x 10¹⁵ |
22Na(n, p)22Ne |
31000 |
2247 |
103 |
4.7 x 10¹² |
|
33S |
0.76 |
33S(n, a)30Si |
0.14 |
3091 |
412 |
1.2 x 10¹⁸ |
|
35Cl |
75.5 |
35Cl(n, p)30S |
0.49 |
598 |
17 |
3.4 x 10¹⁷ |
|
40K |
0.012 |
40K(n, p)40Ar |
4.4 |
2231 |
56 |
3.8 x 10¹⁶ |
|
59Ni* |
1.3 x 10²⁰ |
59Ni(n, a)56Fe |
12.3 |
4757 |
340 |
1.4 x 10¹⁶ |
Tab. 1: Summary of the reaction characteristics and detection limits of NDP in NPI Rez.Examples of the NDP energy spectra from boron, lithium and nitrogen containing materials are shown in Fig. 1 and 2. Fig. 1 shows the energy spectrum of a thin surface deposit of boron on Si3N4/Si(001). Within 10B, about 94 % of the neutron reactions proceed as 10B + n → (1472 keV) + 7Li(840 keV) + (478 keV) and about 6 percent of the reactions as 10B + n → (1776 keV) + 7Li(1013 keV). The background counts in the low energy part are from the energetic photons and electrons. The 1472 keV alpha particle or its 840 keV 7Li recoil peaks are typically used for the profile determination, because of their high intensity.
Example of investigated systems:
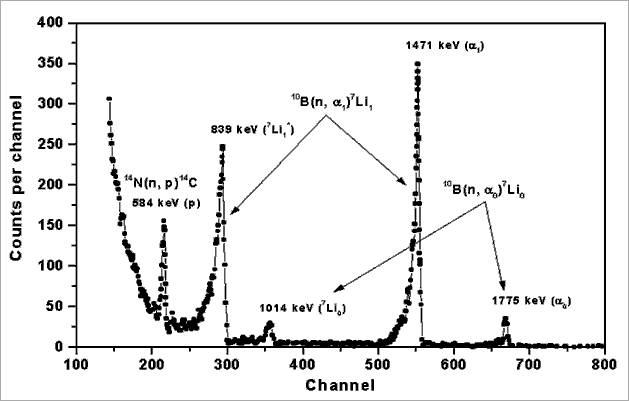 Fig.1: Energy profile of particles emitted by the 10B(n, )7Li and 14N(n, p)14C reactions.
NDP has become an important investigative tool in materials science and technology. In NPI Rez, NDP is routinely used to determine the elemental profiles in various solids, e.g, in nonlinear optical materials (LiNbO3), polymers, metallic alloys and carbon derivates, or composites synthesized from carbon, nitrogen and boron, etc. Long-term experience has shown that NDP is an effective analytical technique (complementary to Rutherford Backscattering), which posses several unique characteristics, i.e., it is nondestructive (even to the organic materials), leaving only trace amounts of residual radioactivity (so the samples can be measured repeatedly), isotopic sensitive, and exhibits the irreplaceable ability to probe the light NDP-active elements in materials up to tens of micrometer depths.
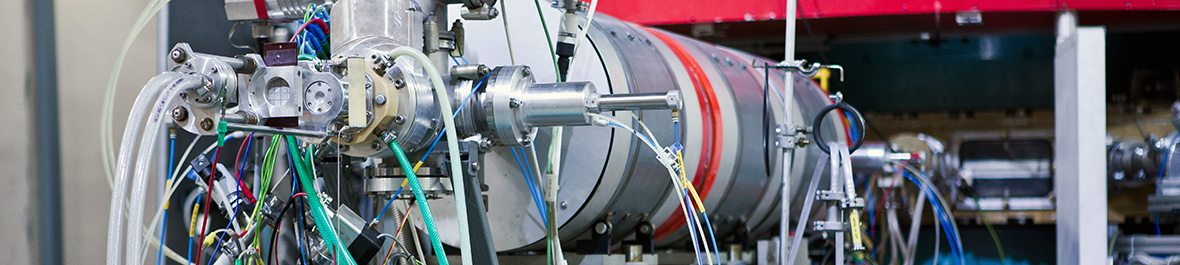
 Fig.2: NDP spectrometer